The key to finding your perfect property should be in your hands. We empower you with valuable insights & tools, and let you be in control of your home search.
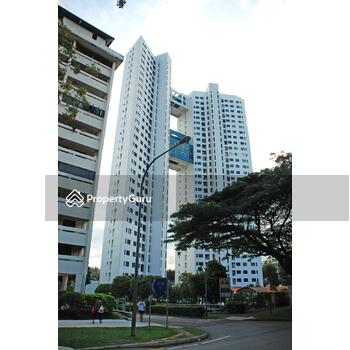
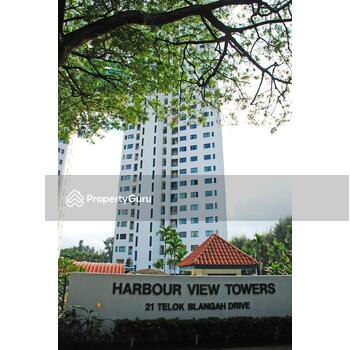
Harbour View Towers
1994 💰💰💰💰 Condominium
Condos ≫ D4 ≫ Harbour View Towers
Condo Info
| Address | 21 Telok Blangah Drive, Singapore 109258 |
| District | D4 |
| Developer | Harbour View Development Pte Ltd |
| Tenure | 99y leasehold from 1 Jun 1990 |
| TOP | 1994 |
| Number of Units | 154 |
| Highest floor | 30 |
| Area (sqm) | 74 - 363 |
| Transactions | Rental ・ Sale ・ Profitability |
Rental Analysis
| Bedrooms | Volume | Low | High | Average | PSF | Yield |
|---|---|---|---|---|---|---|
| 1 | 13 | $3,300 | $4,100 | $3,827 | $5.06 | - |
| 3 | 23 | $4,100 | $9,500 | $5,702 | $3.82 | - |
| 4 | 2 | $7,500 | $7,500 | $7,500 | $3.19 | 2.47% |
| Bedrooms | Volume | Low | High | Average | PSF | Yield |
|---|---|---|---|---|---|---|
| 1 | 38 | $3,100 | $4,600 | $3,788 | $5.02 | - |
| 3 | 75 | $3,700 | $9,500 | $5,431 | $3.72 | 2.66% |
| 4 | 3 | $7,300 | $7,500 | $7,433 | $3.16 | 2.36% |
| Bedrooms | Volume | Low | High | Average | PSF | Yield |
|---|---|---|---|---|---|---|
| 1 | 141 | $2,300 | $4,600 | $3,150 | $4.18 | 3.64% |
| 3 | 281 | $2,400 | $9,500 | $4,376 | $3.05 | 2.76% |
| 4 | 11 | $5,000 | $7,500 | $6,082 | $2.59 | 2.69% |
| Bedrooms | Volume | Low | High | Average | PSF | Yield |
|---|---|---|---|---|---|---|
| 1 | 206 | $2,300 | $4,600 | $3,236 | $4.29 | 5.54% |
| 3 | 382 | $2,400 | $9,500 | $4,387 | $3.05 | 4.51% |
| 4 | 15 | $5,000 | $7,500 | $6,100 | $2.60 | 4.04% |
| 5 | 3 | $8,800 | $9,000 | $8,933 | $2.26 | 3.32% |
| NA | 460 | $1,060 | $10,000 | $3,023 | $2.62 | - |
👉🏻 View all rental transactions
Sale & Profitability Analysis
| Bedrooms | Volume | Low | High | Average Price | PSF |
|---|---|---|---|---|---|
| 4 | 2 | $2.368m | $2.600m | $2.484m | $1,548 |
| Bedrooms | Volume | Low | High | Average Profit | Years Held | Annualized |
|---|---|---|---|---|---|---|
| 4 | 2 | $450k | $1,068k | $759k | 9.75 | 4.74% |
| Bedrooms | Volume | Low | High | Average Price | PSF |
|---|---|---|---|---|---|
| 3 | 2 | $1.950m | $2.100m | $2.025m | $1,680 |
| 4 | 3 | $2.368m | $2.800m | $2.589m | $1,610 |
| Bedrooms | Volume | Low | High | Average Profit | Years Held | Annualized |
|---|---|---|---|---|---|---|
| 3 | 1 | $570k | $570k | $570k | 8.87 | 3.97% |
| 4 | 2 | $450k | $1,068k | $759k | 9.75 | 4.74% |
| Bedrooms | Volume | Low | High | Average Price | PSF |
|---|---|---|---|---|---|
| 1 | 8 | $0.980m | $1.175m | $1.098m | $1,378 |
| 3 | 7 | $1.150m | $2.100m | $1.605m | $1,326 |
| 4 | 18 | $1.500m | $2.800m | $1.882m | $1,153 |
| Bedrooms | Volume | Low | High | Average Profit | Years Held | Annualized |
|---|---|---|---|---|---|---|
| 1 | 6 | -$91k | $775k | $218k | 12.11 | 1.58% |
| 3 | 6 | $132k | $1,012k | $532k | 12.23 | 3.7% |
| 4 | 12 | -$180k | $1,093k | $540k | 12.2 | 2.81% |
| Bedrooms | Volume | Low | High | Average Price | PSF |
|---|---|---|---|---|---|
| 1 | 52 | $0.336m | $1.219m | $0.740m | $929 |
| 2 | 1 | $0.800m | $0.800m | $0.800m | $991 |
| 3 | 55 | $0.535m | $2.100m | $0.984m | $813 |
| 4 | 93 | $0.600m | $3.300m | $1.307m | $771 |
| 5 | 4 | $2.200m | $4.100m | $3.194m | $817 |
| Bedrooms | Volume | Low | High | Average Profit | Years Held | Annualized |
|---|---|---|---|---|---|---|
| 1 | 28 | -$328k | $775k | $186k | 7.05 | 9.05% |
| 3 | 24 | -$410k | $1,012k | $336k | 8.38 | 5.91% |
| 4 | 41 | -$675k | $1,520k | $343k | 7.61 | 7.29% |
| 5 | 3 | $375k | $975k | $633k | 5.37 | 5.39% |
👉🏻 View all sale transactions
👉🏻 View all profitability


