The key to finding your perfect property should be in your hands. We empower you with valuable insights & tools, and let you be in control of your home search.
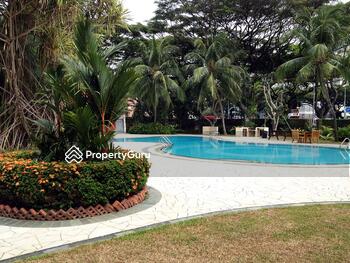
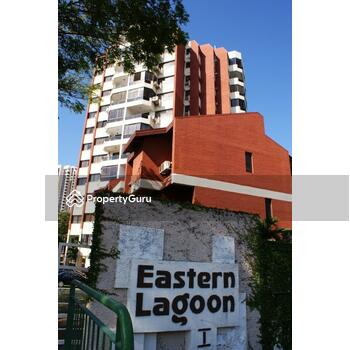
Eastern Lagoon I
1985 💰💰💰 Condominium
Condos ≫ D15 ≫ Eastern Lagoon I
Condo Info
| Address | 200 Upper East Coast Road, Singapore 455283 |
| District | D15 |
| Developer | Eastern Lagoon Pte Ltd |
| Tenure | Freehold |
| TOP | 1985 |
| Number of Units | 307 |
| Highest floor | 18 |
| Area (sqm) | 67 - 379 |
| Transactions | Rental ・ Sale ・ Profitability |
Rental Analysis
No rental transaction
No rental transaction
No rental transaction
No rental transaction
👉🏻 View all rental transactions
Sale & Profitability Analysis
| Bedrooms | Volume | Low | High | Average Price | PSF |
|---|---|---|---|---|---|
| 2 | 4 | $1.020m | $1.710m | $1.255m | $1,584 |
| 3 | 3 | $1.650m | $1.928m | $1.769m | $1,713 |
| 4 | 1 | $2.089m | $2.089m | $2.089m | $1,645 |
| Bedrooms | Volume | Low | High | Average Profit | Years Held | Annualized |
|---|---|---|---|---|---|---|
| 2 | 2 | $415k | $1,007k | $711k | 17.53 | 5.33% |
| 3 | 3 | $778k | $1,215k | $954k | 19.32 | 4.77% |
| Bedrooms | Volume | Low | High | Average Price | PSF |
|---|---|---|---|---|---|
| 2 | 11 | $1.020m | $1.710m | $1.345m | $1,713 |
| 3 | 6 | $1.600m | $1.928m | $1.702m | $1,679 |
| 4 | 4 | $2.089m | $2.280m | $2.187m | $1,620 |
| 5 | 1 | $3.480m | $3.480m | $3.480m | $1,720 |
| Bedrooms | Volume | Low | High | Average Profit | Years Held | Annualized |
|---|---|---|---|---|---|---|
| 2 | 6 | $415k | $1,007k | $645k | 16.06 | 5.3% |
| 3 | 5 | $299k | $1,215k | $754k | 13.55 | 5.63% |
| 4 | 2 | $572k | $1,230k | $901k | 17.74 | 3.56% |
| Bedrooms | Volume | Low | High | Average Price | PSF |
|---|---|---|---|---|---|
| 2 | 40 | $0.790m | $1.710m | $1.120m | $1,419 |
| 3 | 14 | $0.990m | $1.928m | $1.464m | $1,455 |
| 4 | 11 | $1.420m | $2.280m | $1.926m | $1,416 |
| 5 | 2 | $3.400m | $3.480m | $3.440m | $1,418 |
| Bedrooms | Volume | Low | High | Average Profit | Years Held | Annualized |
|---|---|---|---|---|---|---|
| 2 | 26 | $35k | $1,007k | $351k | 11.73 | 3.51% |
| 3 | 12 | -$60k | $1,215k | $466k | 10.62 | 4.1% |
| 4 | 8 | $220k | $1,230k | $675k | 12.76 | 4.16% |
| 5 | 1 | $2,410k | $2,410k | $2,410k | 13.69 | 9.43% |
| Bedrooms | Volume | Low | High | Average Price | PSF |
|---|---|---|---|---|---|
| 2 | 180 | $0.368m | $1.710m | $0.797m | $997 |
| 3 | 83 | $0.515m | $1.928m | $0.903m | $887 |
| 4 | 64 | $0.665m | $2.280m | $1.130m | $825 |
| 5 | 28 | $0.815m | $3.480m | $1.595m | $646 |
| Bedrooms | Volume | Low | High | Average Profit | Years Held | Annualized |
|---|---|---|---|---|---|---|
| 2 | 81 | -$237k | $1,007k | $225k | 8.99 | 5.05% |
| 3 | 37 | -$239k | $1,215k | $262k | 9.46 | 5.87% |
| 4 | 21 | -$320k | $1,230k | $344k | 7.86 | 0.6% |
| 5 | 8 | $112k | $2,410k | $716k | 7.68 | 8.73% |
👉🏻 View all sale transactions
👉🏻 View all profitability
Location

🔍
🔍

🔍