The key to finding your perfect property should be in your hands. We empower you with valuable insights & tools, and let you be in control of your home search.
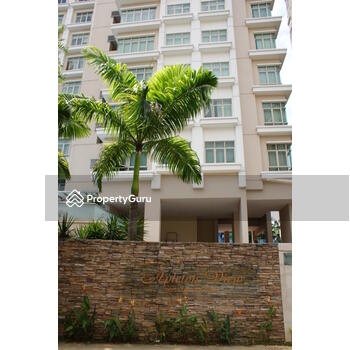
Apleton View
2003 💰💰💰💰 Apartment
Condo Info
| Address | 71 Sinaran Drive, Singapore 308323 |
| District | D11 |
| Developer | Yong Da Development |
| Tenure | Freehold |
| TOP | 2003 |
| Number of Units | 37 |
| Highest floor | 14 |
| Area (sqm) | 98 - 198 |
| Transactions | Rental ・ Sale ・ Profitability |
Rental Analysis
| Bedrooms | Volume | Low | High | Average | PSF | Yield |
|---|---|---|---|---|---|---|
| 3 | 6 | $4,600 | $5,500 | $5,033 | $4.08 | 2.47% |
| Bedrooms | Volume | Low | High | Average | PSF | Yield |
|---|---|---|---|---|---|---|
| 3 | 18 | $4,000 | $5,800 | $4,947 | $4.07 | 2.51% |
| Bedrooms | Volume | Low | High | Average | PSF | Yield |
|---|---|---|---|---|---|---|
| 3 | 71 | $1,300 | $5,800 | $3,995 | $3.47 | 2.35% |
| Bedrooms | Volume | Low | High | Average | PSF | Yield |
|---|---|---|---|---|---|---|
| 3 | 113 | $1,300 | $5,800 | $4,068 | $3.73 | 4.15% |
| NA | 78 | $2,000 | $5,300 | $3,335 | $3.31 | - |
👉🏻 View all rental transactions
Sale & Profitability Analysis
| Bedrooms | Volume | Low | High | Average Price | PSF |
|---|---|---|---|---|---|
| 3 | 3 | $2.130m | $2.420m | $2.323m | $1,988 |
| Bedrooms | Volume | Low | High | Average Profit | Years Held | Annualized |
|---|---|---|---|---|---|---|
| 3 | 3 | -$30k | $920k | $495k | 9.07 | 2.18% |
| Bedrooms | Volume | Low | High | Average Price | PSF |
|---|---|---|---|---|---|
| 3 | 6 | $2.130m | $2.420m | $2.315m | $1,945 |
| Bedrooms | Volume | Low | High | Average Profit | Years Held | Annualized |
|---|---|---|---|---|---|---|
| 3 | 6 | -$30k | $920k | $577k | 11.2 | 2.36% |
| Bedrooms | Volume | Low | High | Average Price | PSF |
|---|---|---|---|---|---|
| 3 | 14 | $1.560m | $2.760m | $2.158m | $1,776 |
| Bedrooms | Volume | Low | High | Average Profit | Years Held | Annualized |
|---|---|---|---|---|---|---|
| 3 | 14 | -$30k | $1,561k | $526k | 9.83 | 2.63% |
| Bedrooms | Volume | Low | High | Average Price | PSF |
|---|---|---|---|---|---|
| 3 | 75 | $0.683m | $2.760m | $1.295m | $1,079 |
| Bedrooms | Volume | Low | High | Average Profit | Years Held | Annualized |
|---|---|---|---|---|---|---|
| 3 | 40 | -$30k | $1,561k | $447k | 7.14 | 5.65% |
👉🏻 View all sale transactions
👉🏻 View all profitability
Location
🔍
