The key to finding your perfect property should be in your hands. We empower you with valuable insights & tools, and let you be in control of your home search.
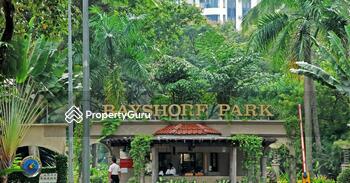
Bayshore Park
1986 💰💰💰 Condominium
Condos ≫ D16 ≫ Bayshore Park
Condo Info
Rental Analysis
Bedrooms
Volume
Low
High
Average
PSF
Yield
1
15
$2,600
$3,350
$2,860
$4.47
4.14%
2
143
$2,000
$4,250
$3,508
$3.71
3.43%
3
68
$3,500
$6,000
$4,434
$3.68
3.45%
4
14
$5,500
$7,650
$6,646
$3.03
3.18%
5
5
$7,200
$10,250
$8,970
$2.60
-
Rental Rate: 29.89%
Bedrooms
Volume
Low
High
Average
PSF
Yield
1
46
$2,000
$4,000
$2,934
$4.44
4.11%
2
506
$1,850
$4,800
$3,503
$3.70
3.4%
3
239
$3,000
$6,000
$4,327
$3.60
3.3%
4
48
$5,000
$10,050
$6,706
$3.06
3.13%
5
15
$6,600
$10,500
$8,803
$2.52
2.95%
Rental Rate: 28.41%
Bedrooms
Volume
Low
High
Average
PSF
Yield
1
153
$1,500
$4,000
$2,212
$3.61
4%
2
2074
$630
$4,800
$2,722
$2.99
3.35%
3
929
$1,300
$6,000
$3,417
$2.94
3.38%
4
177
$3,200
$10,050
$5,165
$2.45
2.95%
5
58
$6,000
$10,500
$7,745
$2.44
3.26%
Rental Rate: 31.82%
Bedrooms
Volume
Low
High
Average
PSF
Yield
1
199
$1,500
$4,000
$2,277
$3.82
5.77%
2
2807
$630
$4,800
$2,791
$3.12
5%
3
1271
$1,300
$6,000
$3,453
$3.01
5.14%
4
254
$3,200
$10,050
$5,131
$2.48
4.5%
5
74
$6,000
$11,300
$7,877
$2.47
4.7%
NA
3755
$800
$9,500
$2,305
$2.30
-
Rental Rate: 30.09%
👉🏻 View all rental transactions
Sale & Profitability Analysis
Bedrooms
Volume
Low
High
Average Price
PSF
1
1
$0.808m
$0.808m
$0.808m
$1,294
2
23
$1.020m
$1.365m
$1.216m
$1,298
3
7
$1.315m
$1.675m
$1.536m
$1,280
4
2
$2.320m
$2.700m
$2.510m
$1,143
Bedrooms
Volume
Low
High
Average Profit
Years Held
Annualized
1
1
$128k
$128k
$128k
5.17
3.39%
2
17
$172k
$901k
$446k
15.12
3.71%
3
5
$270k
$1,000k
$592k
16.15
3.85%
4
1
$1,935k
$1,935k
$1,935k
19.66
6.62%
Resale Rate: 3.34%
Bedrooms
Volume
Low
High
Average Price
PSF
1
1
$0.808m
$0.808m
$0.808m
$1,294
2
49
$1.020m
$1.390m
$1.225m
$1,308
3
20
$1.315m
$1.798m
$1.580m
$1,309
4
7
$2.320m
$2.750m
$2.598m
$1,173
5
1
$3.410m
$3.410m
$3.410m
$1,025
Bedrooms
Volume
Low
High
Average Profit
Years Held
Annualized
1
1
$128k
$128k
$128k
5.17
3.39%
2
40
$172k
$901k
$422k
12.08
4.74%
3
17
$189k
$1,120k
$689k
15.67
4.83%
4
4
$550k
$1,935k
$1,166k
16.33
3.98%
5
1
$460k
$460k
$460k
6.07
2.42%
Resale Rate: 2.43%
Bedrooms
Volume
Low
High
Average Price
PSF
1
8
$0.628m
$0.808m
$0.690m
$1,082
2
172
$0.700m
$1.390m
$1.003m
$1,071
3
95
$0.823m
$1.798m
$1.263m
$1,041
4
29
$1.630m
$2.750m
$2.201m
$994
5
11
$2.700m
$3.500m
$3.117m
$900
Bedrooms
Volume
Low
High
Average Profit
Years Held
Annualized
1
7
-$10k
$243k
$80k
10.32
1.16%
2
138
-$100k
$901k
$249k
11.3
2.76%
3
77
-$180k
$1,120k
$324k
10.82
2.78%
4
23
-$120k
$1,935k
$612k
10.76
3.19%
5
9
-$250k
$1,650k
$674k
10.29
2.65%
Resale Rate: 2.91%
Bedrooms
Volume
Low
High
Average Price
PSF
1
49
$0.290m
$0.808m
$0.511m
$795
2
865
$0.300m
$1.390m
$0.703m
$750
3
545
$0.360m
$1.798m
$0.859m
$702
4
136
$0.700m
$2.750m
$1.463m
$660
5
62
$1.000m
$3.600m
$2.220m
$632
Bedrooms
Volume
Low
High
Average Profit
Years Held
Annualized
1
27
-$200k
$346k
$105k
8.62
5.33%
2
470
-$300k
$901k
$157k
7.7
5.21%
3
285
-$408k
$1,120k
$223k
7.07
6.87%
4
61
-$570k
$1,935k
$559k
7.77
11.04%
5
32
-$1,430k
$2,100k
$538k
6.82
7.14%
Resale Rate: 4.98%
👉🏻 View all sale transactions 👉🏻 View all profitability
Location


